
ralphadu-twum@hotmail.co.uk
I am an aspiring Data Analyst and recent graduate of the Generation Data Analytics Bootcamp, where I built a strong technical foundation in SQL, Python, and Power BI.
My interest in data began with a natural curiosity for patterns and problem-solving, particularly when doing chemical engineering projects at university where I looked to boost efficiency and reduce waste. Seeing how data could influence operational decisions sparked my desire to pursue analytics professionally.
Alongside my technical training, my background in optics and customer-facing roles has developed my communication skills and attention to detail. Working in fast-paced environments required me to interpret complex needs, provide practical solutions, and collaborate effectively with colleagues and customers.
Curious, analytical, and growth-oriented, I am eager to contribute to data-driven organisations while continuing to develop my technical and professional expertise.
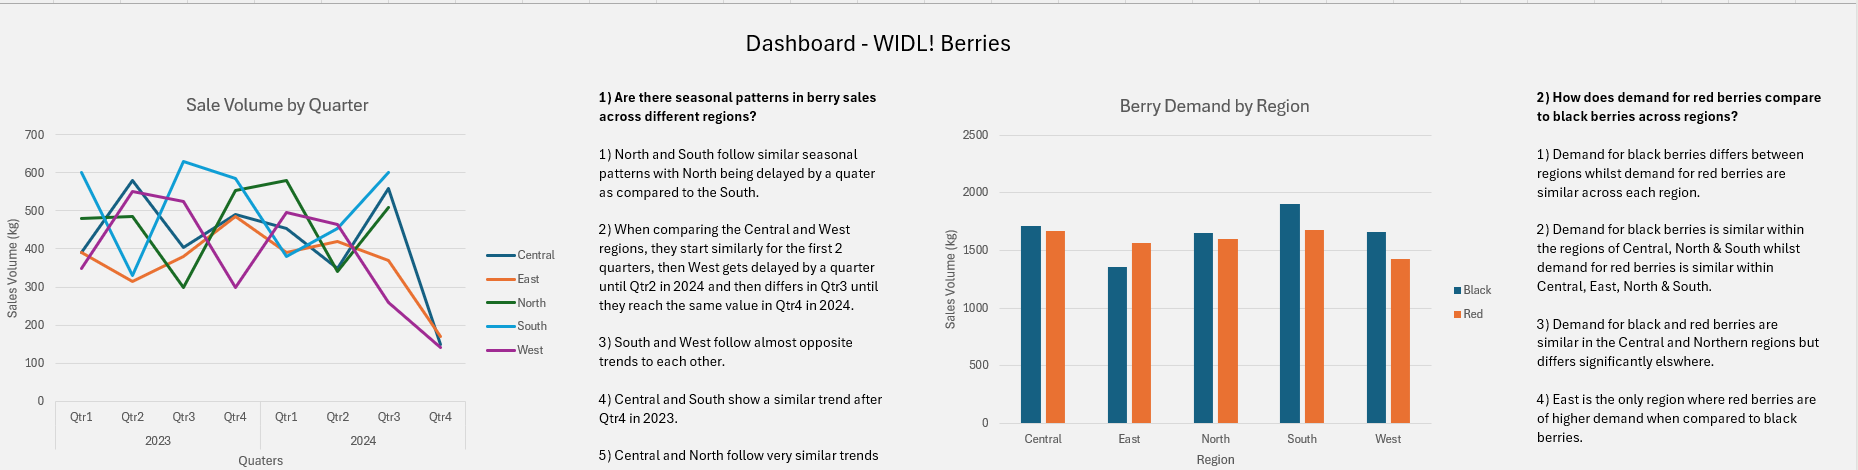
Using Excel to create a dashboard using Pivot Tables and Pivot Charts to identify trends and insights around the weekly sale of berries in a North America store.
 View Excel file on GitHub
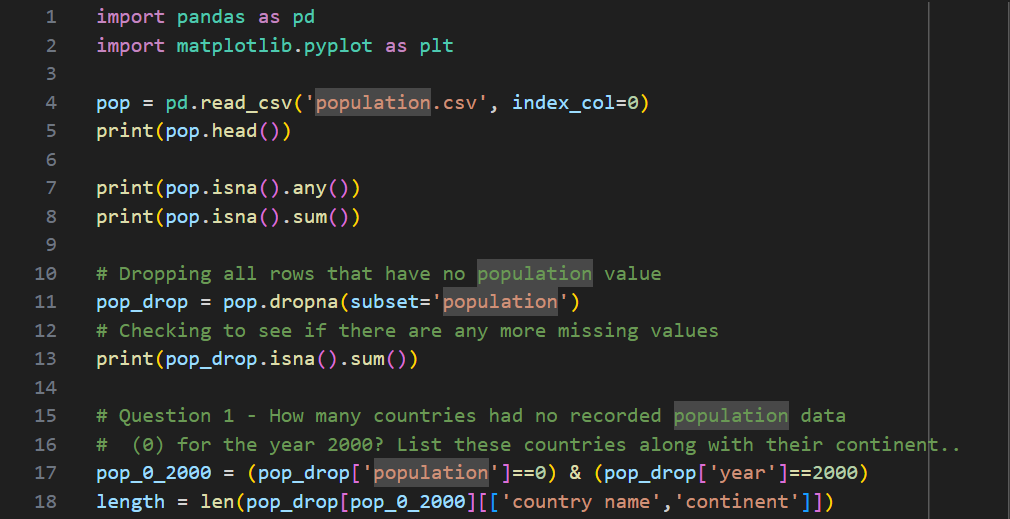
Analysing population statistics as part of a fictional company GlobalTech.
 View Source Code on GitHub
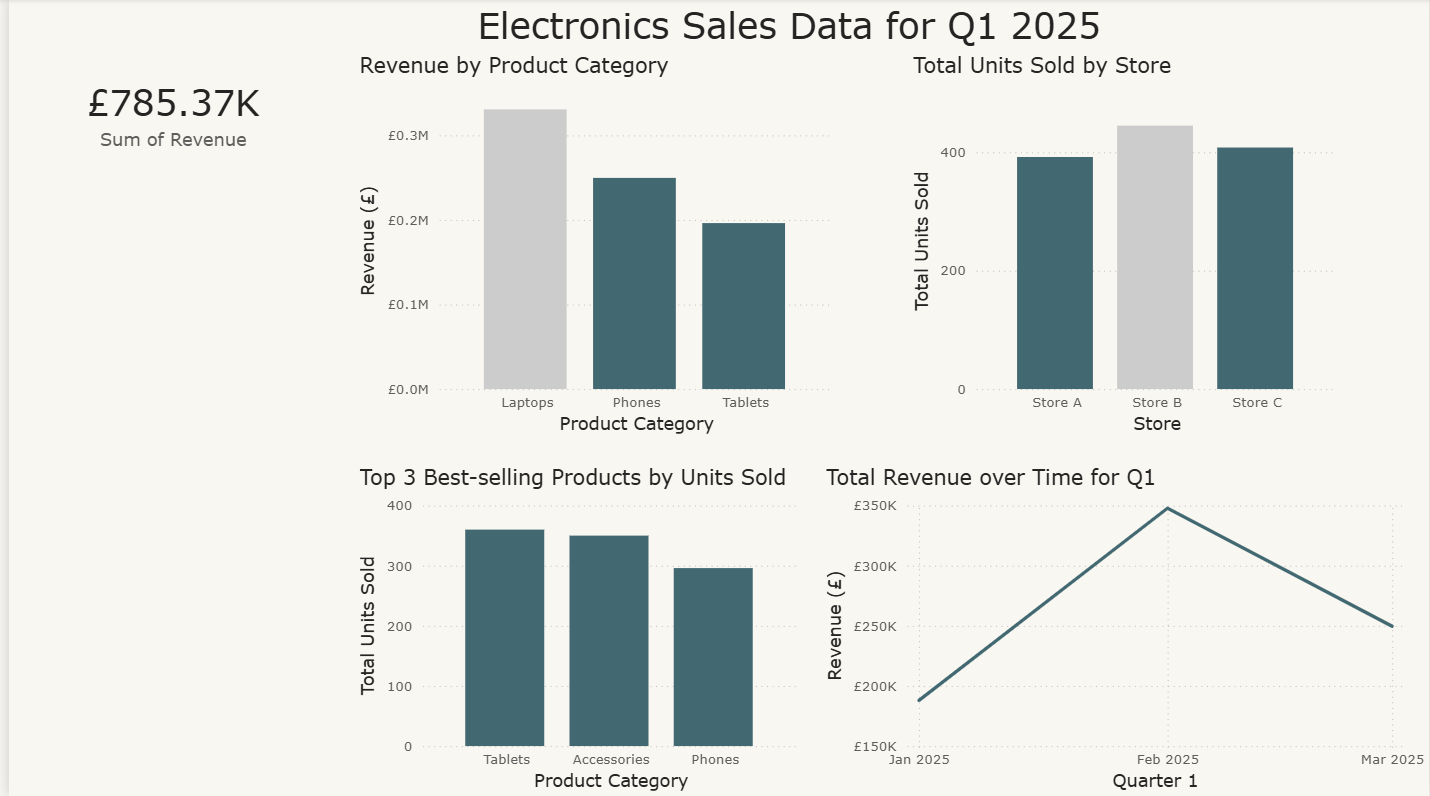
This dashboard visualizes sales performance of an electronics company.
 View Project Overview on GitHub
This section demonstrates SQL JOIN skills.
--      Displays the average South American population in 2000
--      from a JOIN of a countries table and populations statistics table.

SELECT AVG(p.population) AS avg_pop_south_america
FROM countries AS c
INNER JOIN population_years AS p
ON c.id = p.country_id
WHERE continent = 'South America' AND year = 2000;
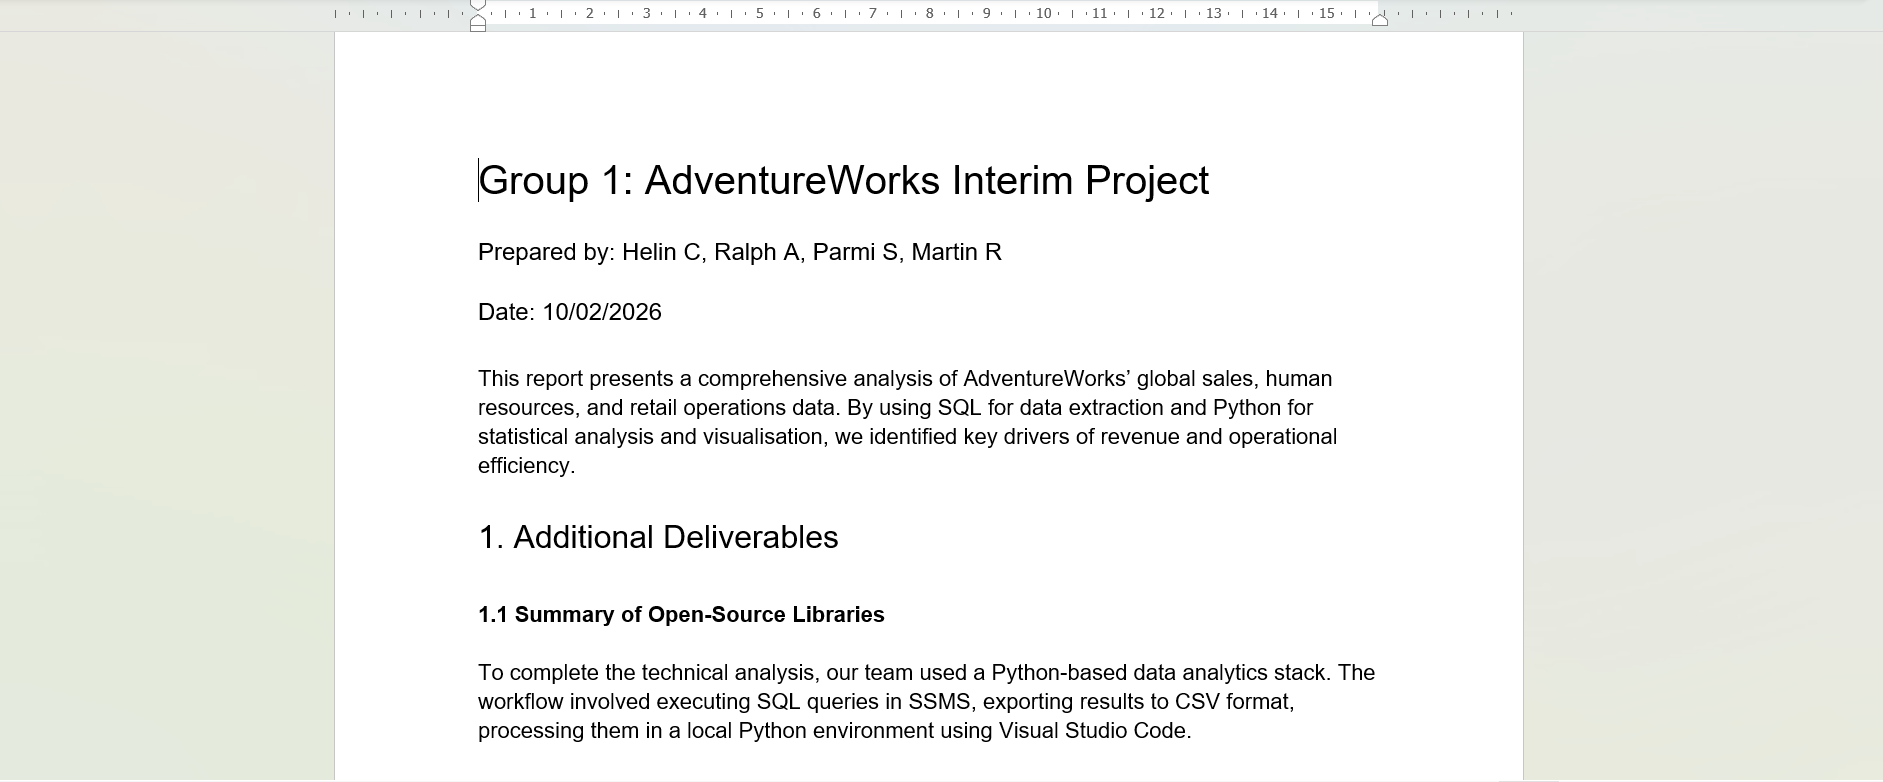
A project using both SQL and Python to conduct a comprehensive analysis of the AdventureWorks 2019 dataset.
 View Source Code on GitHub
A project using Power BI to conduct an explorative analysis of a Brazilian e-commerce.
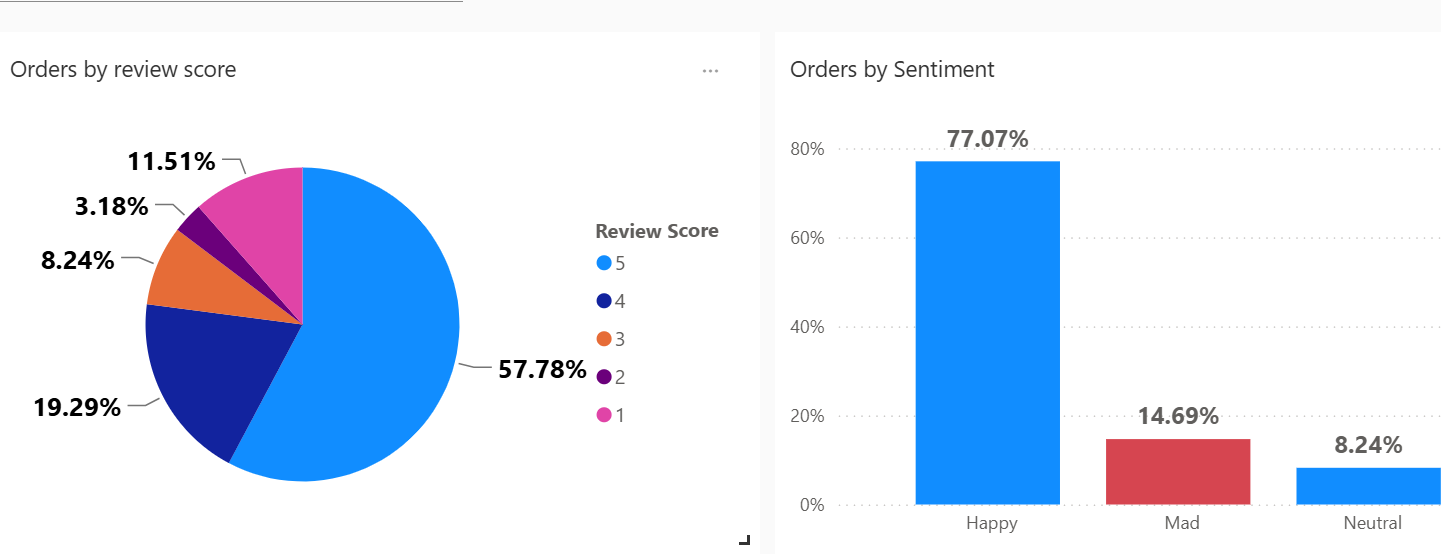 View Project Overview on GitHub
A project using Excel and Power BI to conduct an analysis of the Top 100 Most Streamed Songs on Spotify.